Level 1
Platform module
ENERGY & CARBON
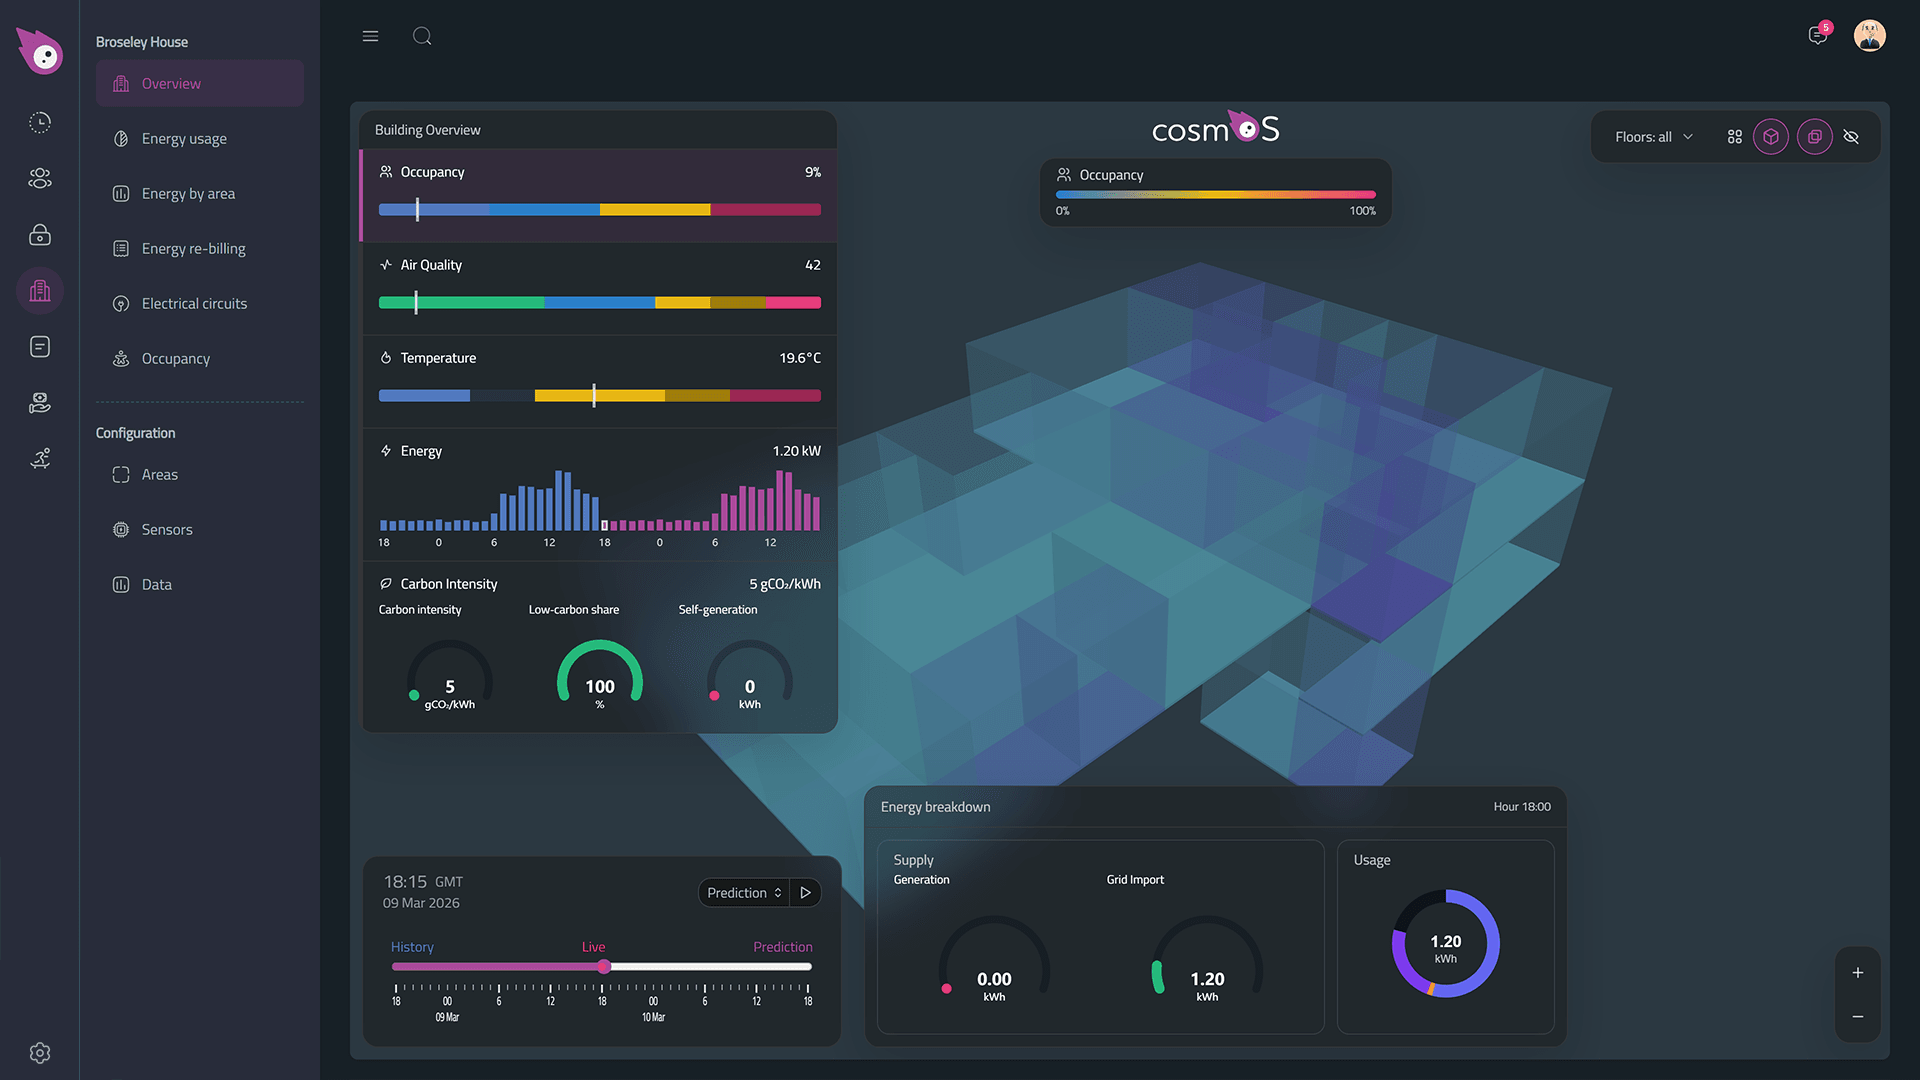
Real-time energy monitoring, Live Carbon™ intensity, and automated cost reduction.
“Know exactly what your building is consuming — and why.”
30% Average energy reductionReal-time Carbon intensityAuto ESG reporting
What it does
Everything you need from energy & carbon
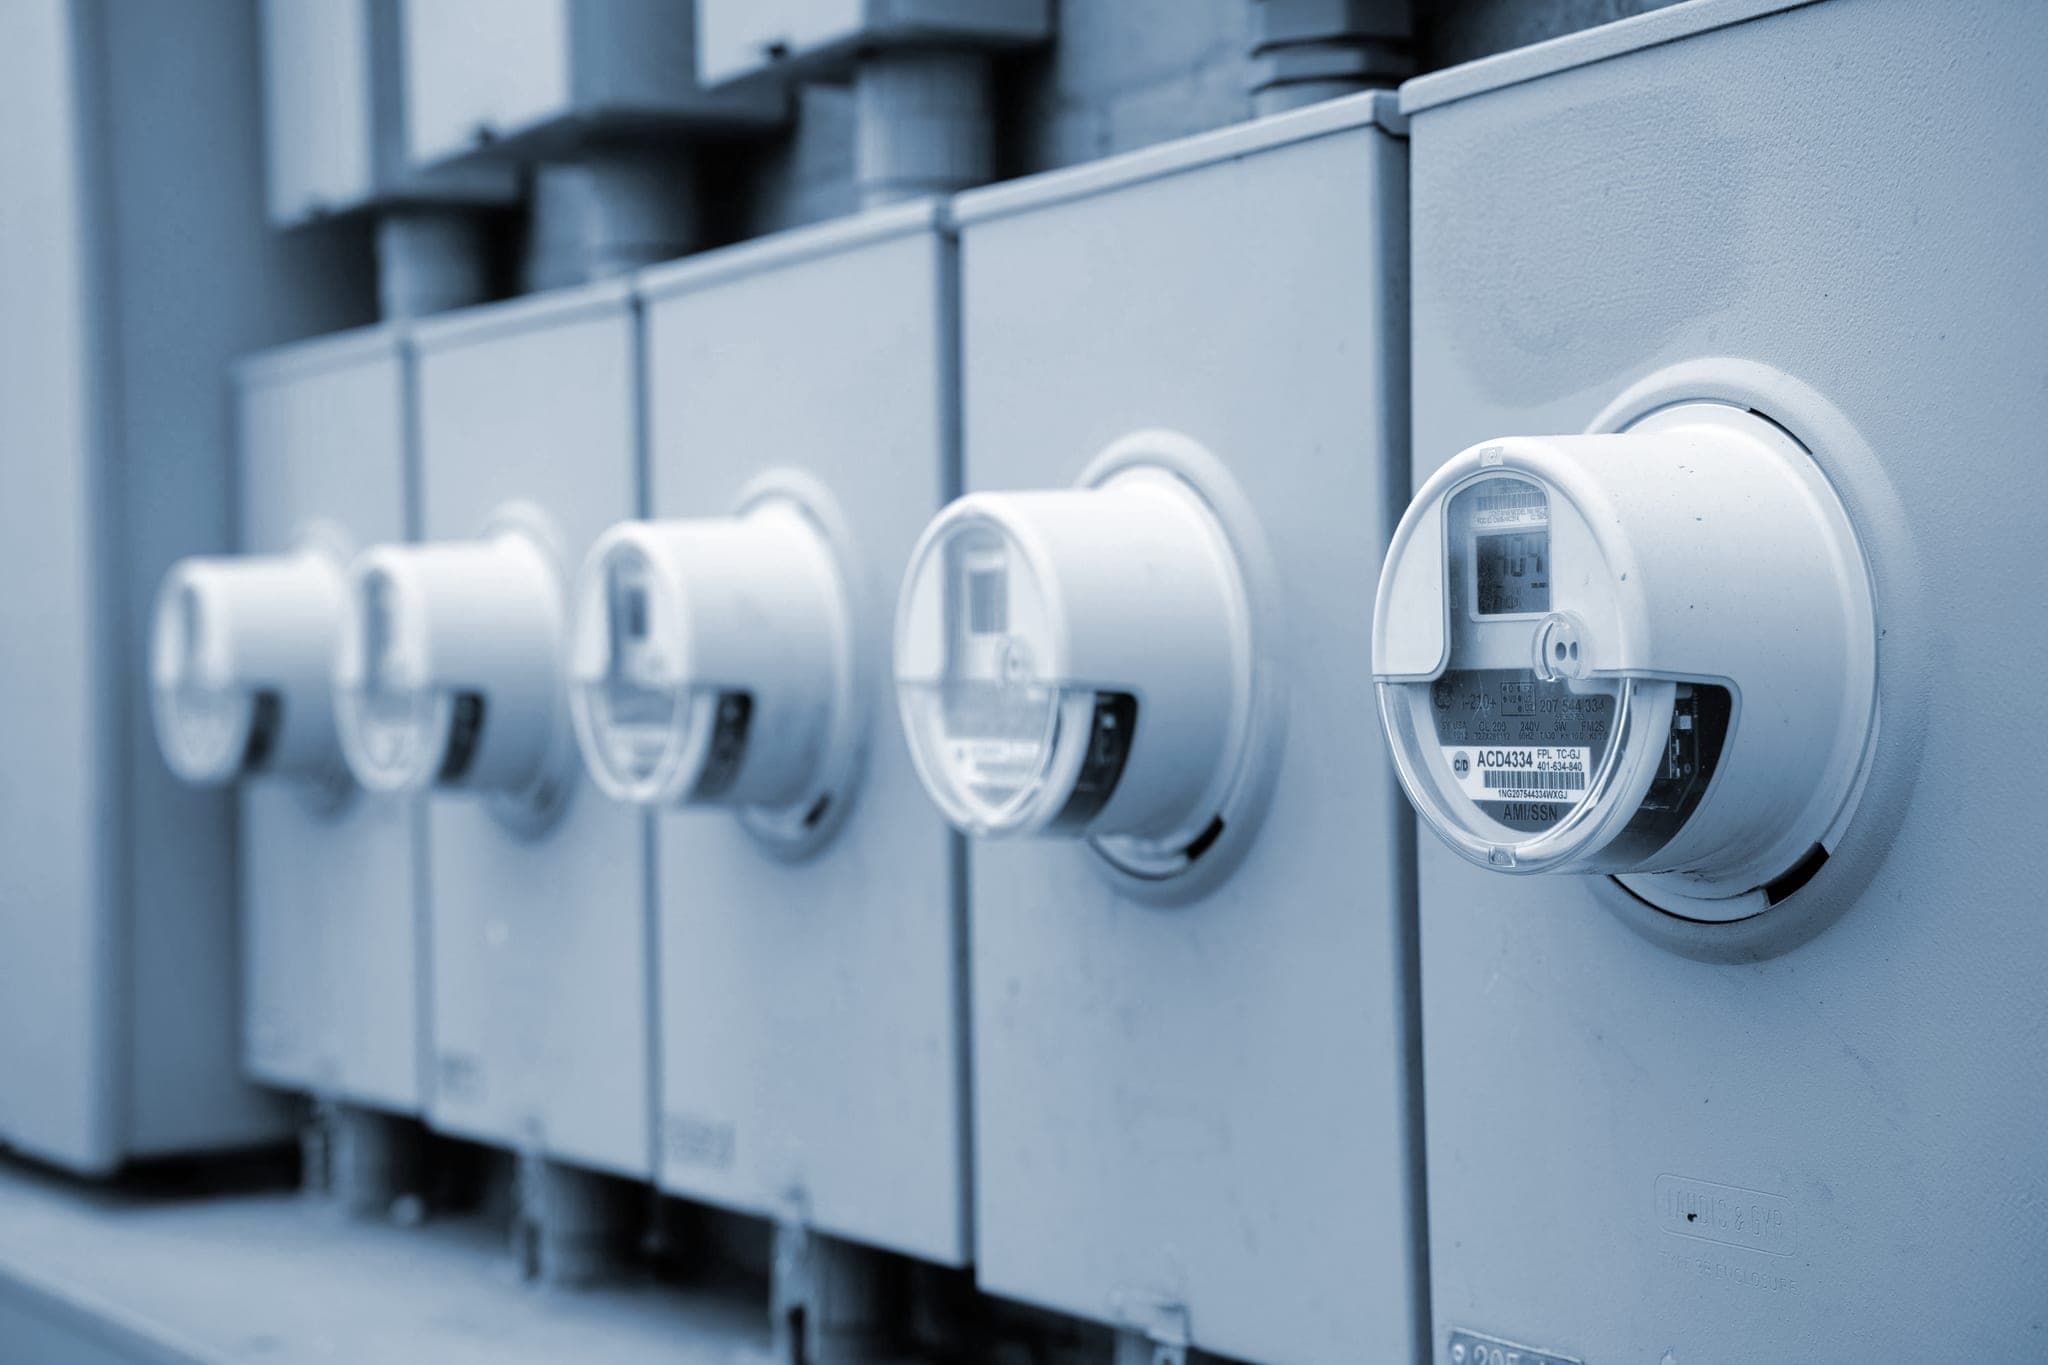
- Sub-meter energy monitoring by zone or circuit
- Live Carbon™ — real-time carbon intensity in gCO2e
- 72-hour carbon trend visualisation
- Smart meter integration (SMETS2)
- Automated alerts on energy anomalies and spikes
- ESG-ready carbon reporting exports
- Solar and battery optimisation via GivEnergy
- Octopus Energy tariff integration for demand shifting
https://cosmos.energy
Installation options
THREE LEVELS OF INSTALLATION
Choose the level of insight that matches your building and budget.
Level 2
Per Floor
Level 3
Per Unit / Circuit
Main Incomer
Floor 1
Floor 2
Floor 3
...
01.01
01.02
01.03
...
Energy monitor
https://cosmos.energy
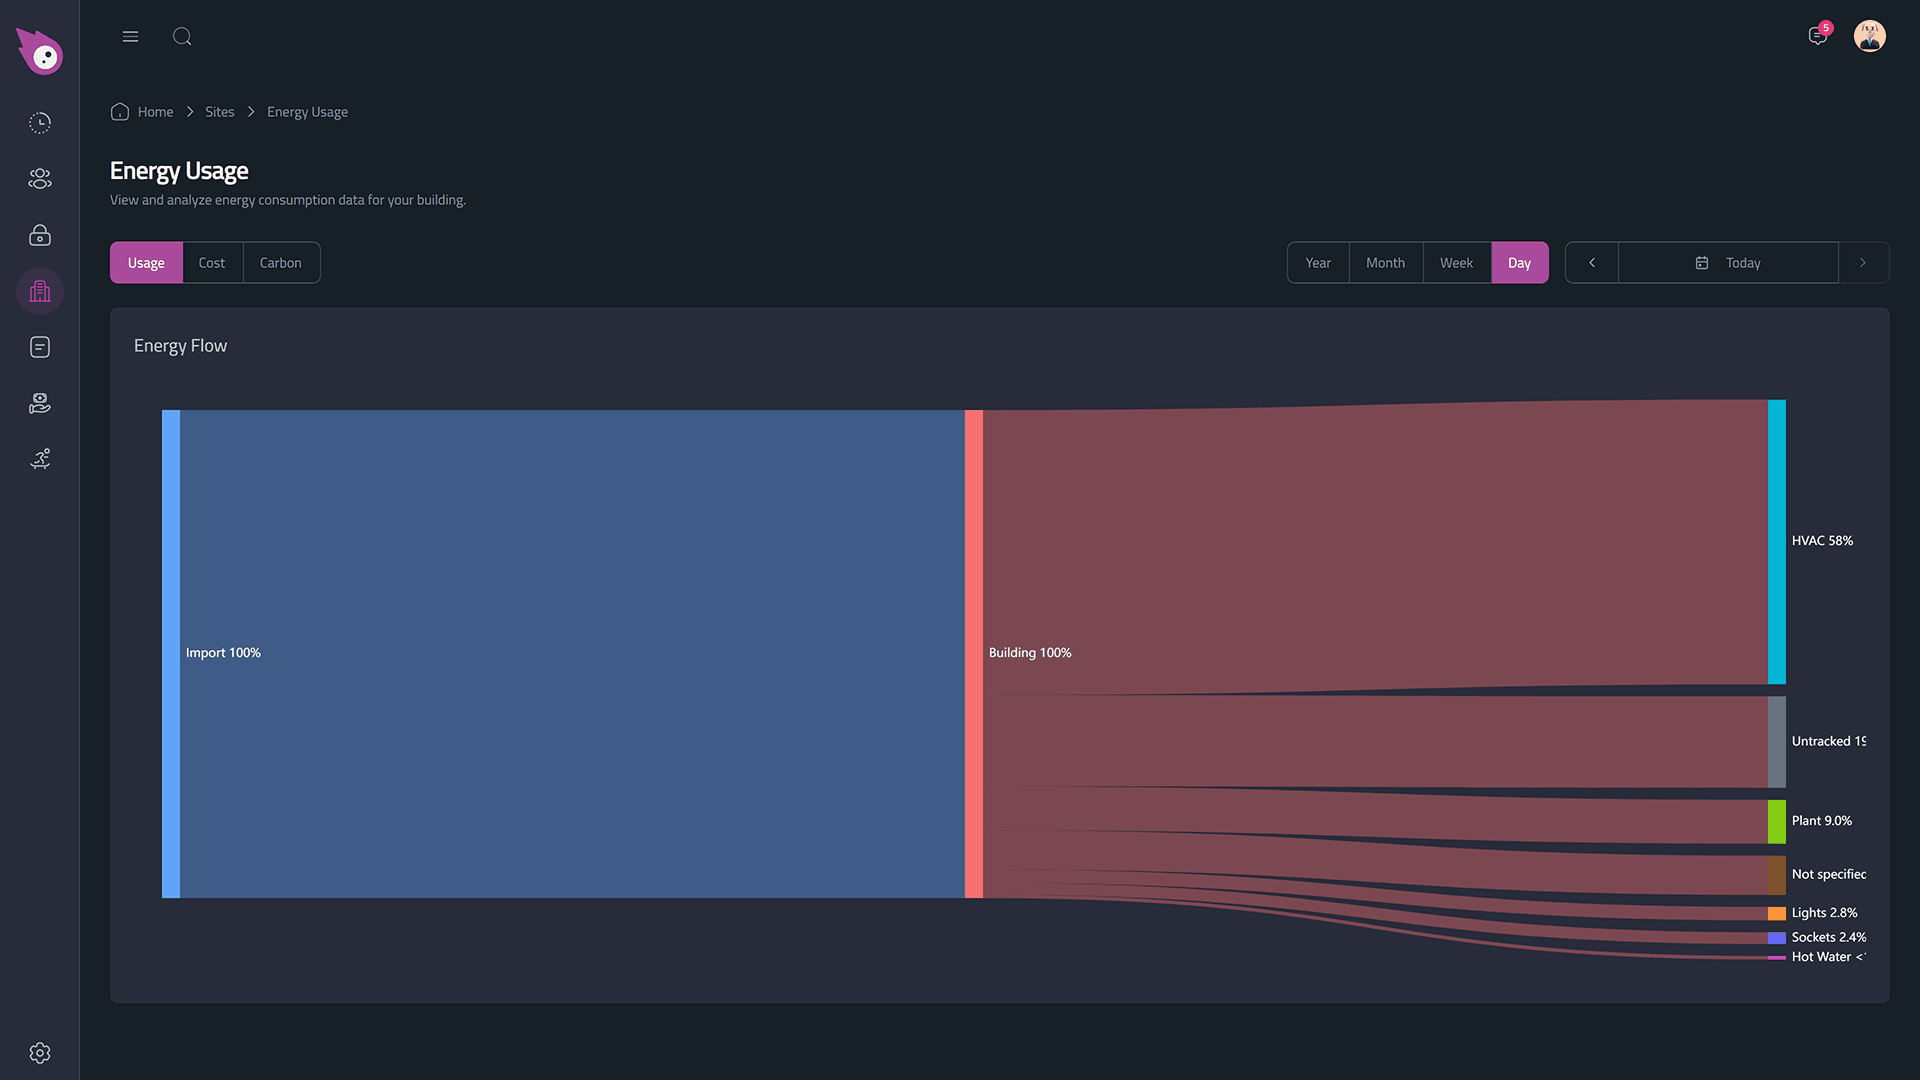
Live carbon intensity and half-hourly energy data across all meter points.
Real-world applications
How buildings use energy
MEES 2027 Compliance
Document energy reduction measures to achieve EPC Band C.
Tenant Sub-billing
Accurate per-zone energy data for fair tenant billing.
Solar Optimisation
Maximise self-consumption from onsite solar generation.
Works with your existing systems
Key integrations
cosmOS connects with the tools your building already uses — no rip-and-replace required.
GivEnergyOctopus EnergySmart Meters Xero+ 27 more integrations
By the numbers
ENERGY & CARBON at a glance
30%Average energy reduction
Real-timeCarbon intensity
AutoESG reporting
Why it matters
BUILT FOR RESULTS
https://cosmos.energy
Know exactly where your energy goes
Half-hourly AMR data, sub-meter breakdowns, and AI anomaly detection. Stop guessing and start seeing where every kWh is consumed.
https://cosmos.energy
Carbon reporting you can actually trust
Live Carbon™ uses real-time grid intensity data — not annual averages. SECR-ready exports in one click, not one spreadsheet.
https://cosmos.energy
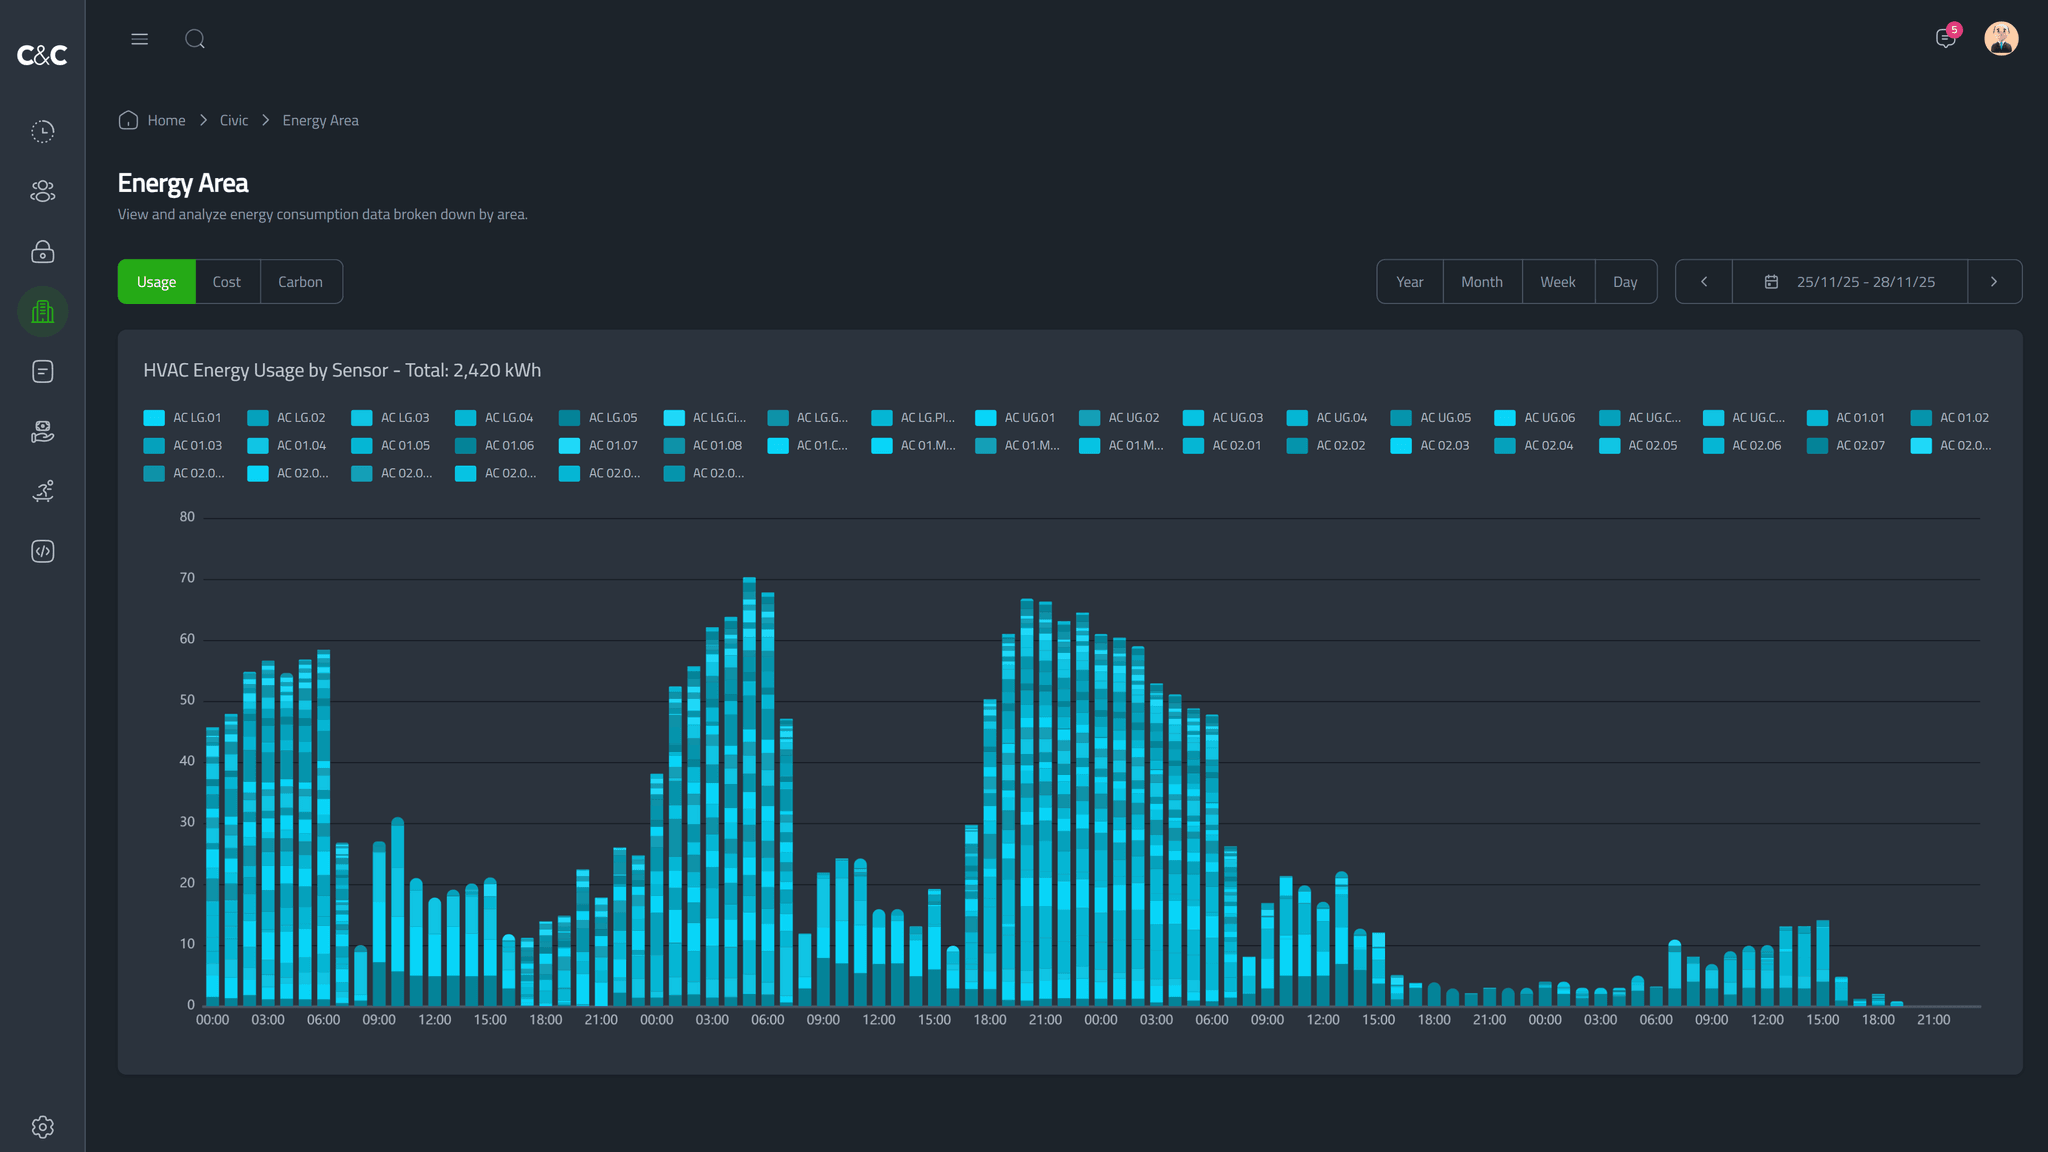
HVAC Energy Usage by Sensor - the out-of-hours consumption pattern that flagged a 17,000 kWh/month anomaly.
17,000 kWh/month - caught by AI
Spot problems before they cost you
cosmOS monitors every circuit, every system, every hour. AI models learn your building's normal consumption patterns and alert you the moment something deviates - whether that's a piece of equipment left running overnight, a misconfigured HVAC schedule, or a new energy-intensive load nobody noticed. In a recent deployment, our AI identified a misconfigured HVAC system that was running outside of operating hours - generating 17,000 kWh of excess consumption every month. The fix took hours. The saving was immediate.
Read the case study→The platform
Explore more features
Feature
EV CHARGING & PAYMENTS
cosmOS transforms building EV chargers from a cost centre into a managed, revenue-generating asset. Set your own pricing, automate billing, and give tenants seamless access — all from one platform.
Feature
ACCESS CONTROL
Keyless, cloud-managed access for every door, every user, every building.
Feature
SPACE MANAGEMENT
Know how your space is really being used — and optimise every square metre.
Feature
ASSET MANAGEMENT
Track every building asset, plan maintenance, and keep service history in one operational register.
Feature
SOLAR & BATTERY MANAGEMENT
cosmOS gives building owners the solar dashboard they actually need — real-time generation monitoring, self-consumption vs export tracking, ROI calculations, and battery optimisation. No more guessing.
Feature
MULTI-SITE MANAGEMENT
One login. Every building. Manage your entire property portfolio from a single cosmOS dashboard.

Ready to see energy in action?
Book a personalised demo and we'll show you exactly how cosmOS delivers energy & carbon for your building type.